
Welcome to Ch 6 Dynamics of Population Notes Class 8! These notes are designed to help you quickly understand key concepts.
Please note that while these notes serve as a great revision tool, they are not a replacement for your Chapter 6 Dynamics of Population NCERT
All the definitions given in the chapter are at the end of the notes.
For more class 8 related resources and notes, Click Here.
What Is Demography?
Demography is the study of the features of the human population
➽ its size, structure, and composition
➽ how these change over time.
Population differs in:
◈ Size ➽ how many people
◈ Structure ➽ how population is organized
◈ Composition ➽ the characteristics of people:
➢➢➢➢➢ Age groups ➜ children, adults, elderly
➢➢➢➢➢ Gender
➢➢➢➢➢ Levels of education
➢➢➢➢➢ Occupations
➢➢➢➢➢ Religion
Population characteristics change over time due to:
➢➢➢➢➢Births
➢➢➢➢➢Deaths
➢➢➢➢➢Movement of people
| Population Feature | Planning Need |
|---|---|
| Many young children | More schools |
| High proportion of elderly | More healthcare facilities |
| High proportion of working-age population | More employment generation |
Uses of Demography
◈ Governments use demography to plan:
➢➢➢Infrastructure ➜ schools, hospitals, roads, housing
➢➢➢Municipal services ➜ water, energy, waste management
◈ Businesses use demography to:
➢➢➢Assess potential customers by age, gender, and income
➢➢➢Create products that match people’s needs
◈ Overall purpose:
➢➢➢For better allocation and management of resources.
Population at a Glance
◈ Improved healthcare ➜ individuals live longer ➜ explains world population growth trajectory
◈ Falling birth rates ➜ population decline after peaking
2023 India surpasses China as the world’s most populous country
India ≈ 17% of world population
| Population Trend | Countries |
|---|---|
| Shrinking population | China, Japan, Italy |
| Growing population (for now) | India |
| Rapidly growing population | Nigeria, Ethiopia |
What Determines the Population of a Country?
➢➢◈ Birth Rate ➢➢➢➢◈Fertility Rate
➢➢◈Death / Mortality Rate
➢➢◈Life Expectancy ➢➢◈Migration
Birth and fertility rates
◈ Birth Rate:
➢Indicates how fast a population is growing, based on the number of babies being born ➢➢➢ High birth rate = faster growth,
➢➢➢ Low birth rate = slower growth or shrinking.
◈ Fertility Rate:
The average number of children a woman is likely to have in her lifetime.
◈ Replacement-Level Fertility Rate:
A fertility rate of 2.1 ➽ the number of children needed to replace the parents in the population and keep it stable.
Death or mortality rate
Death or mortality rate
◈ An indicator of population growth;
➢➢➢ Lower mortality rate shows the availability of quality healthcare and better nutrition in a country.
Life Expectancy
◈ The average number of years a newborn is expected to live, if they grow up with the same health, safety, and living conditions people in their country have today.
Migration
Movement of people into or out of an area,
for better employment opportunities or education,
or due to natural disasters and political instability.
Imp Relationships
◈ fertility rate above 2.1,
➢➢➢ population is likely to grow;
◈ fertility rate below 2.1,
➢➢➢ population might shrink over time.
◈ Improved access to quality education (especially for girls) ➜ women marry later and have fewer children ➜ falling fertility and birth rates.
| ‘Hum do humare do’ from 1952 | Government campaign pushing for population control via fewer children |
| South Korea, Taiwan, Singapore, Japan, China, Italy, Spain, France | Countries witnessing a trend of low fertility rates |
| Delhi, Mumbai, Bengaluru | Cities that saw significant population growth due to migration |
How Do Countries Experience Population Change?
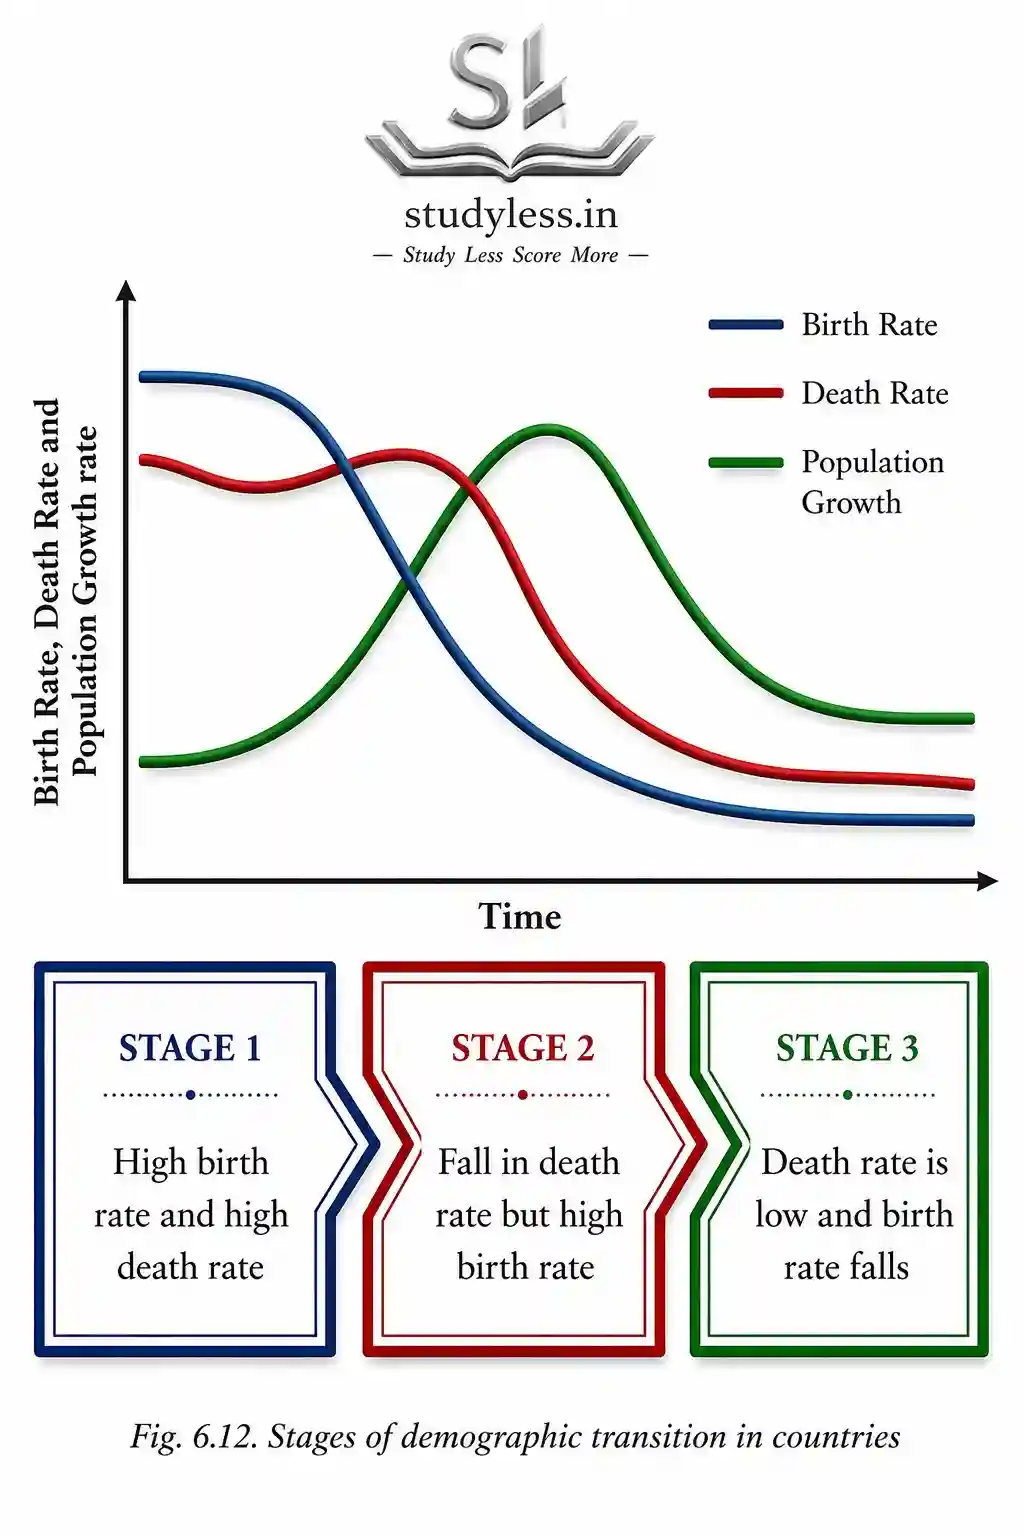
Demographic Transition
◈ A sequence of three stages explaining a country's population changes over time.
Driven by economic development, improved healthcare, education, and greater women's participation in household decisions.
| Stage | Birth Rate | Death Rate | Population Growth |
|---|---|---|---|
| Stage 1 | High | High | Very slow or stagnant |
| Stage 2 | Stays high | Falls | Rapid growth |
| Stage 3 | Begins to fall | Low | Growth slows; may shrink if fertility drops significantly |
◈ Stage 3 birth rate falls due to: rising urbanization, higher income, education, and more women in the workforce having fewer children.
| Period | India's Stage |
|---|---|
| 1901–1921 | Stage 1 (poor healthcare, low literacy) |
| After 1951 | Stage 2 (rapid population growth) |
| Mid-1980s onwards | Stage 3 (fertility declining, now below replacement level) |
| Italy, Japan, South Korea | European/East Asian countries with shrinking population (Stage 3, significant fertility drop) |
India’s Population: Composition and Trends
Population Composition (Structure):
◈ Characteristics of a population ➽ age, gender, occupation, education, etc. ➽ studied to understand people better.
Sex Ratio
◈ Number of females per 1,000 males in a population; measures gender balance and reflects socio-economic and cultural dynamics.
Population Pyramid (Population Structure Diagram)
◈ A graph showing the number of people in a country by age group and gender ➽ bottom = young people, middle = adults, top = elderly.
Demographic Dividend
◈ A large working-age population (15–60 years) that can help drive economic growth.
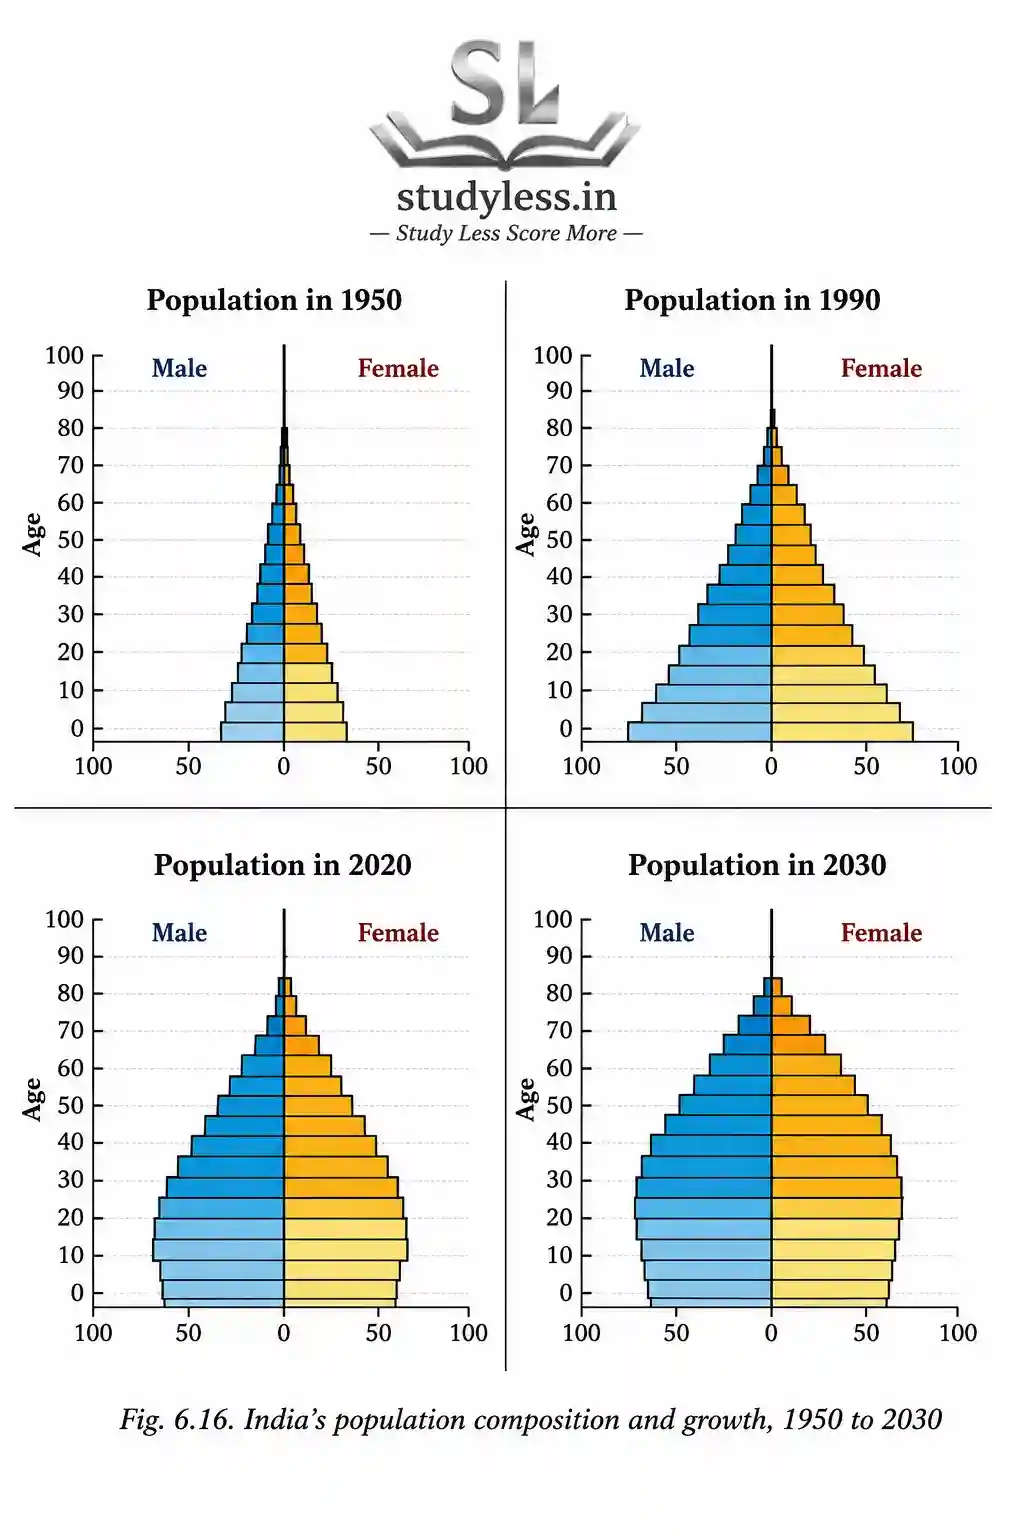
| Pyramid Shape | Meaning | Example |
|---|---|---|
| Wide base | Young, growing population | India, Nigeria |
| Wide middle | Stable population (mostly working adults) | — |
| Wide top | Ageing population | Japan |
India's Pyramid
◈ 1950s: Narrow triangle ➜ high birth rate, many children, few elderly.
➢➢➢ Low life expectancy ➜ poor healthcare and nutrition.
◈ Recent years: Bell shape ➜ fewer children, more working-age people.
➢➢➢ Working-age population ➜ demographic dividend.
➢➢➢ Top widening ➜ longer life due to better healthcare and living conditions.
◈ Overall: Young, fast-growing population ➜ more balanced population ➜ gradual ageing may begin.
India’s Demographic Dividend — A Limited Window of Opportunity
Youth Bulge
◈ A large young population (16–30 years)
◈Common in countries at Stage 2 of demographic transition.
Demographic Dividend
The economic growth potential of a nation resulting from a younger and productive age structure.
Double Burden
Challenge faced by women managing both job responsibilities and household duties as more of them pursue formal jobs.
Imp Relationships
◈ Large working-age population ➜ more people working ➜ greater economic activity ➜ country grows; workers also earn and pay taxes ➜ government builds schools, hospitals, roads, parks.
◈ Ageing population ➜ more elderly needing care + fewer young workers ➜ pressure on healthcare, slower economy and governments struggle to pay pensions/services due to fewer young taxpayers
◈ Lack of childcare facilities, joint family support, and flexible work hours ➜ makes it difficult for women to participate in the workforce.
◈ Supportive family systems + childcare infrastructure ➜ helps convert the demographic dividend into lasting progress.
| Indicator | Value |
|---|---|
| Indian population under 15 years | ~27% |
| Indian population in working-age group (15–59 years) | ~65% |
| States | Ageing Trend |
|---|---|
| Kerala, Tamil Nadu | Significant population ageing |
| Bihar, Uttar Pradesh | Comparatively less ageing (younger population) |
| Example | Concept Demonstrated |
|---|---|
| Japan | Developed country response to ageing — raised retirement age, uses technology/automation, robots and AI assistants, large-scale community centres for elderly care |
| Fertility revival policies | Largely unsuccessful so far |
Definitions From Textbook
FAQs: Ch 6 Dynamics of Population Notes Class 8
Are these notes accurate and based on the latest NCERT curriculum?
Yes. These notes strictly follow the official Class 8 NCERT textbook guidelines and include exact textbook definitions to ensure complete accuracy for exams.
Will studying only these notes be enough for my exam preparation?
They cover all core concepts, trends, and definitions for quick understanding and high-yield revision. However, reading the NCERT chapter alongside them is recommended for thorough preparation
How are these notes better or more useful than just reading the textbook?
They cut through long paragraphs by using structured comparison tables, flowcharts, and clear visual summaries so you can memorize key facts in half the time.