
“Ch 9 The Price Puzzle: What Drives the Market Notes” is created out of the your NCERT textbook – Understanding Society: India and Beyond Grade 9 – Part 1, chapter 9 The Price Puzzle: What Drives the Market
These notes are finally published after multiple readings and actual class room consultations.
Read your NCERT textbook and then turn to these notes for final preparationa nd retention.
Other chapter notes | Understanding Society: India and Beyond Grade 9 – Part 1
Demand
Definition:
The quantity of a product people are willing and able to buy at a particular price, depending on needs, preferences, season, trend, and income.
In Simple Words
Demand = wanting something + having the money to buy it.
Demand is not just desire. It needs purchasing power (ability to pay).
Purchasing power:
It is a measure of how much one unit of a particular currency can buy at a particular time.
Exam Fact:
Demand always means willingness + ability to buy, not just wanting something.
Law of Demand
Statement
When price rises, quantity demanded falls. When price falls, quantity demanded rises.
In Simple Words
People buy less when price goes up, and buy more when price goes down.
Relationship between Demand and Price
Inverse Relationship
Remember
Price ⬆ ⇒ Demand ⬇
Price ⬇ ⇒ Demand ⬆
Example
Mango price falls from ₹150 to ₹50 ➜ Srivalli buys more mangoes (1 kg ➜ 3 kg).
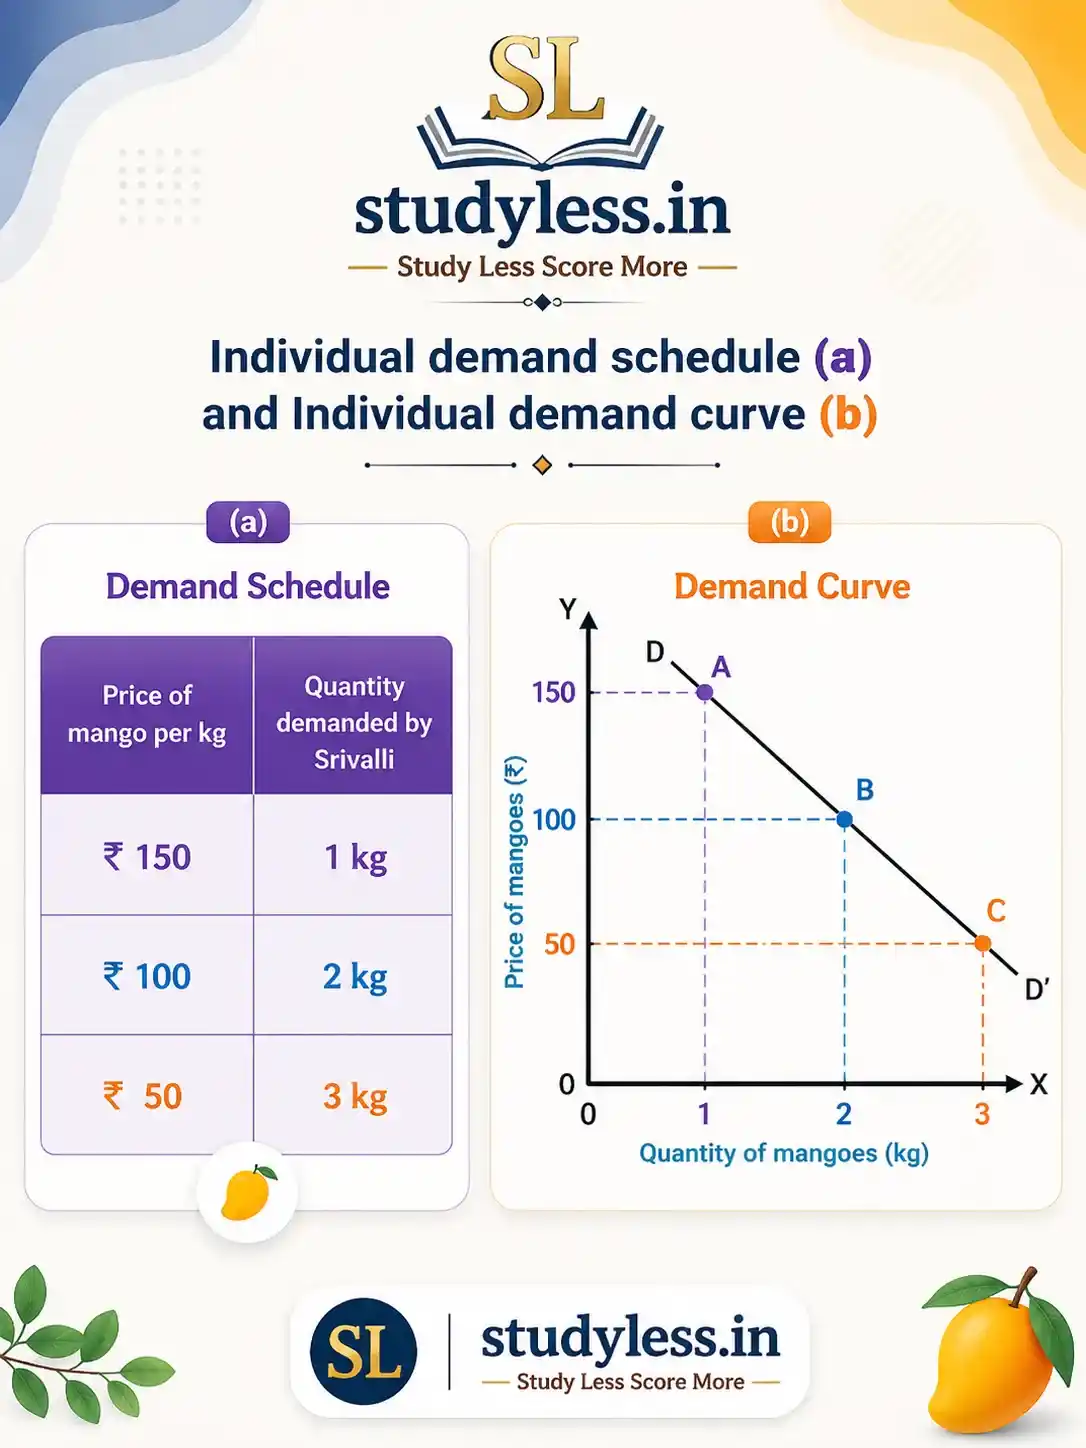
Demand Curve (Individual or Market)
- Downward sloping (left to right)
- Price⬆ = Quantity demanded ⬇
- Shows inverse relationship between price and quantity
Individual Demand vs Market Demand
⁕ Individual demand:
Quantity one buyer wants at different prices, other factors constant.
⁕ Market demand:
Total quantity demanded by all buyers at different prices (sum of individual demands).
| Individual Demand | Market Demand |
|---|---|
| One buyer’s demand | Sum of all buyers’ demand |
| Example: Srivalli alone | Srivalli + Alex + Israt |
| Shown by demand schedule of one person | Shown by adding all schedules |
| Curve is steeper | Curve is flatter (more responsive) |
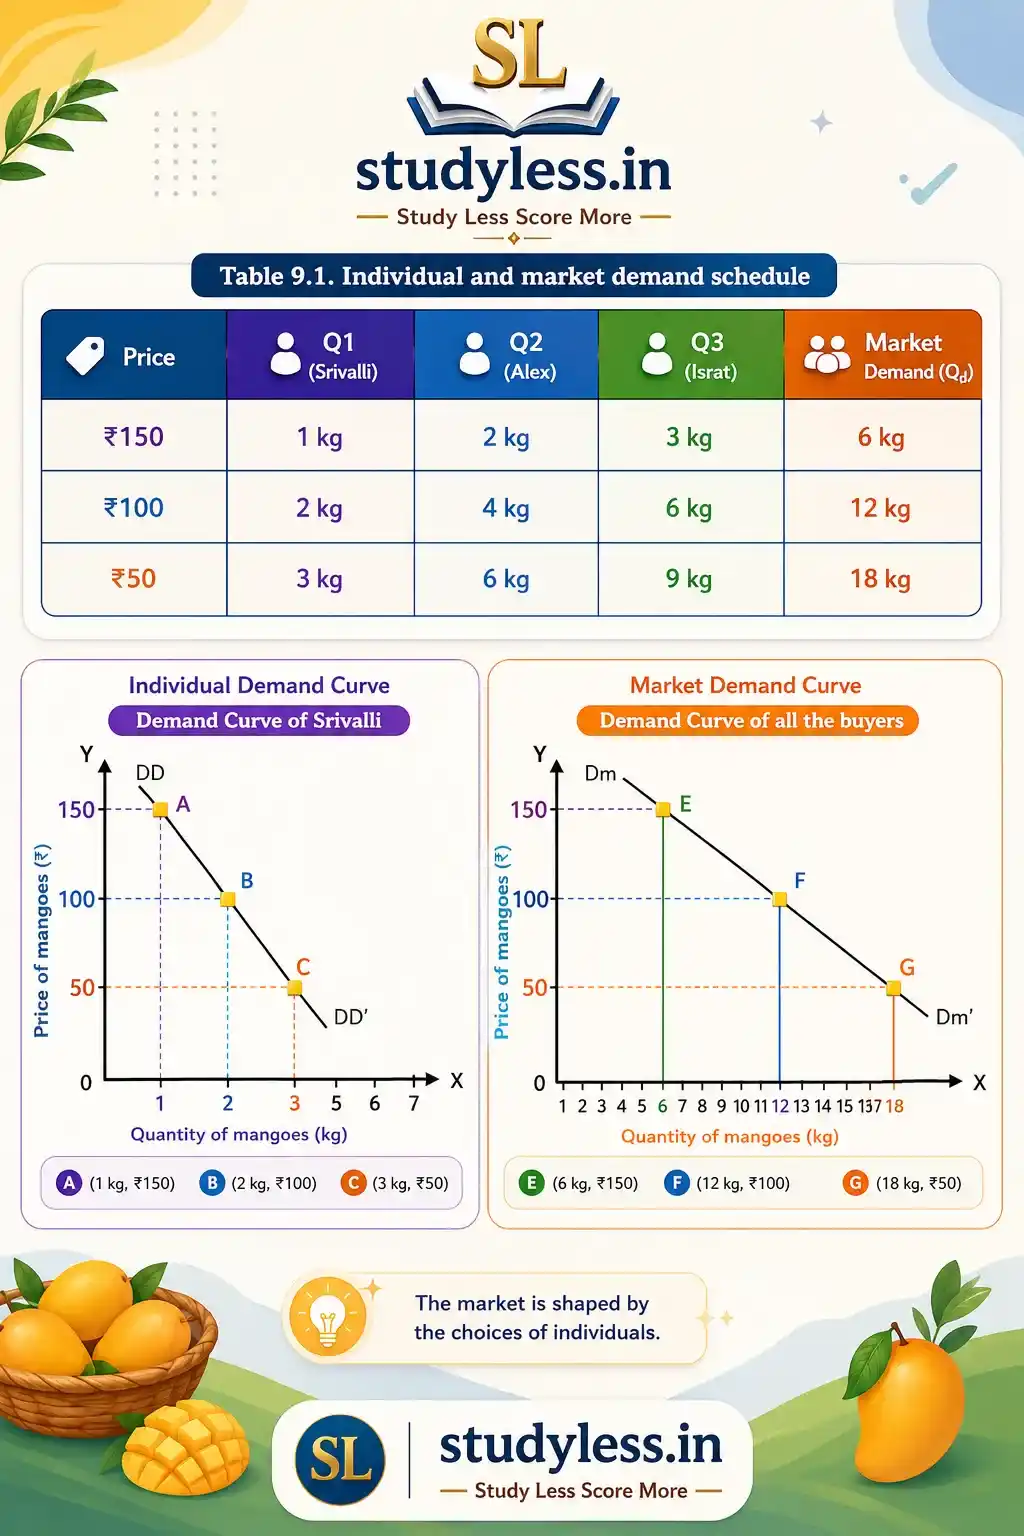
Market Demand = Q1 + Q2 + Q3 + … (sum of all individual demands at each price)
Market demand curve is flatter than individual demand curve.
Other Determinants of Demand
Besides price, many other factors affect how much people want to buy.
In Simple Words
Demand can change even if price stays the same, because of other reasons.
Price of related goods
| a) Substitute goods | b) Complementary goods |
|---|---|
| Can replace each other | Used together |
| Example: tea and coffee | Example: smartphones and earphones |
| If price of one rises, demand for other rises | If demand for one rises, demand for other also rises |
| Example: mangoes and bananas | Example: cars and petrol, printers and cartridges |
Income of the consumer
⁕ Rise in income ⇒ people buy more or better-quality goods.
⁕ Higher income ⇒ higher demand
Taste and preference of the buyer
Liking a product increases its demand, even if costlier
eg, if you like mangoes even if its price increases you will buy it.
⁕ More population ⇒ more demand.
⁕ Composition matters too (children ➜ sports shoes, elderly ➜ orthopedic shoes).
Seasonality
Demand changes with season, festivals, and weather (e.g., sweaters in winter, sweets during festivals).
Future price expectations
Expecting a price rise ➜ buy now. Expecting a fall ➜ wait and buy later.
Supply
Definition:
The quantity of a product that sellers are willing and able to offer at a particular price.
In Simple Words
Supply = how much sellers want to sell at a given price.
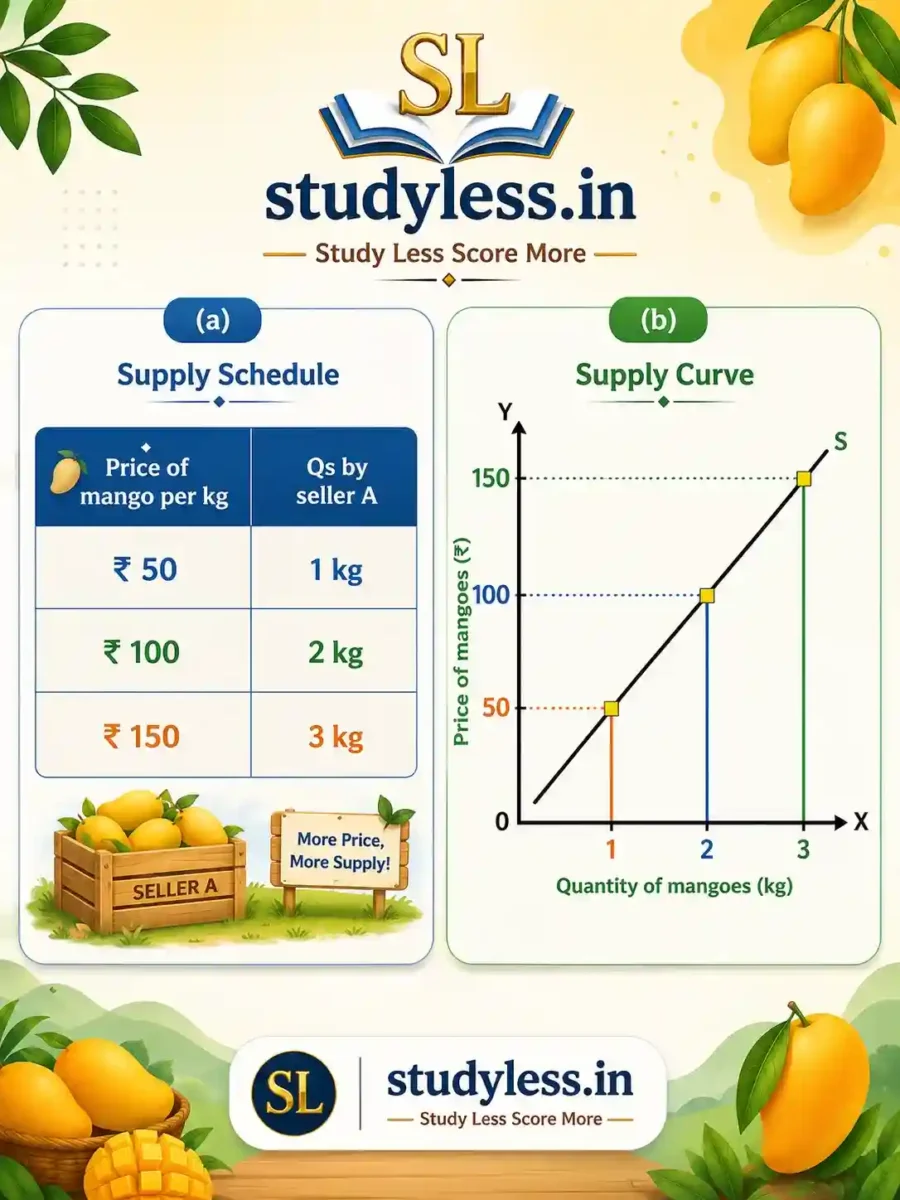
Imp Points
⁕ As price increases, quantity supplied increases.
⁕ As price decreases, quantity supplied falls.
⁕ Higher prices increase profit, so producers make more and new firms enter the market.
Exam Fact
Supply moves in the same direction as price.
Law of Supply
Statement
When price rises, quantity supplied increases. When price falls, quantity supplied decreases.
In Simple Words
Sellers sell more when price is high, and sell less when price is low.
Relationship
Direct Relationship
Remember
Price ⬆ ⇒ Supply ⬆
Price ⬇ ⇒ Supply ⬇
Example
Mango price rises from ₹50 to ₹150 ➜ seller supplies more mangoes (1 kg ➜ 3 kg).
Individual Supply vs Market Supply
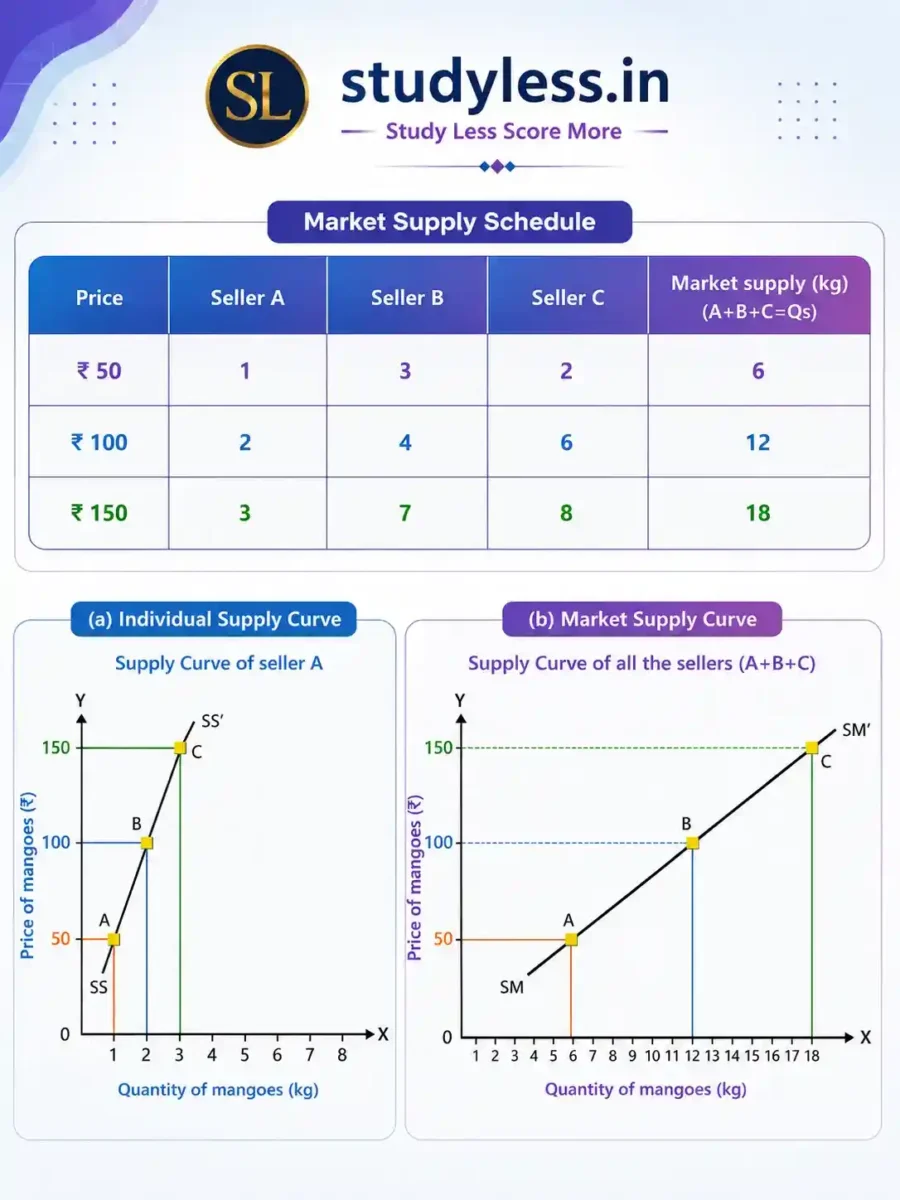
- Individual supply: Quantity one seller offers at different prices.
- Market supply: Sum of all sellers’ supply at different prices.
Graph Meaning
Supply Curve (Individual or Market)
- Upward sloping (left to right)
- Price ⬆ ⇒ Quantity supplied ⬆
- Shows direct relationship between price and quantity
Price-Demand-Supply Link
- Supply low + Demand high ➜ Price rises (e.g., start of mango season)
- Supply high + Demand same/low ➜ Price falls (e.g., mid mango season)
Other Determinants of Supply
Supply can change without any change in price — because of related goods’ prices, number of sellers, technology, or future expectations.
Price of related goods
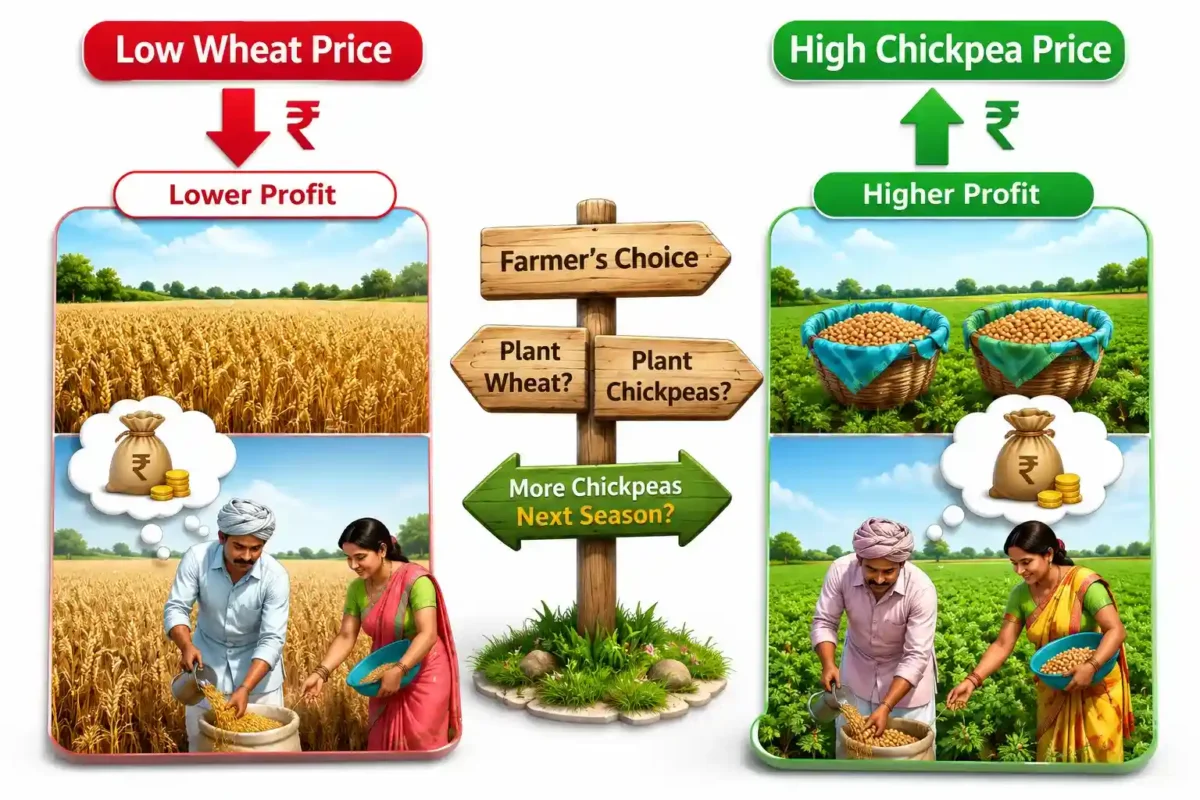
Supplier grows/makes whichever good is more profitable
Example
Wheat price is low, chickpea price is high ➜ farmer grows more chickpeas next season.
Number of sellers in the market
Number of sellers: More sellers ➜ higher competition ➜ supply exceeds demand ➜ prices fall. Fewer sellers ➜ supply falls ➜ prices rise.
Technology
Technology: Better technology lowers production cost ➜ producers supply more. Example: drip irrigation, weather sensors, cold storage.
Future expectations
Future Expectations: Expecting future demand boom ➜ produce and supply more now. Expecting a price rise later ➜ hold back supply now to sell later at higher price.
Exam Fact
Potato wholesalers holding back stock, expecting higher prices later, is an example of future expectations affecting supply.
Market Equilibrium
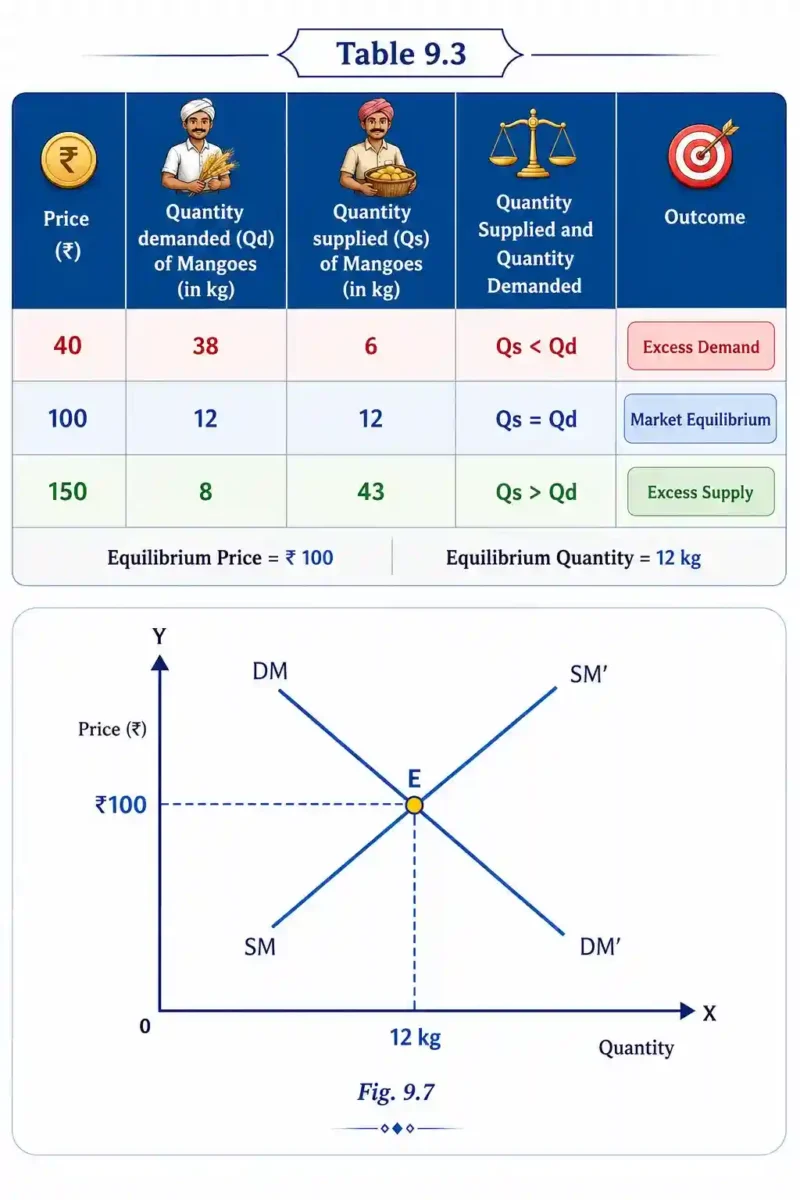
The point where quantity demanded equals quantity supplied. Price is decided by demand and supply meeting each other.
In Simple Words
Equilibrium is when buyers and sellers agree — no shortage, no extra stock.
Features of Market Equilibrium
⁕ At a lower price, quantity demanded is more than quantity supplied ➜ Excess Demand.
⁕ At a higher price, quantity supplied is more than quantity demanded ➜ Excess Supply.
⁕ At the equilibrium price, Qs = Qd. No pressure for price to change.
⁕ Market is “cleared” — no shortage, no surplus.
Exam Fact
At equilibrium: Quantity Supplied = Quantity Demanded
Remember
Qs < Qd ➜ Excess Demand (shortage) Qs = Qd ➜ Equilibrium Qs > Qd ➜ Excess Supply (surplus)
Example
At ₹100 per kg, mangoes demanded = 12 kg and mangoes supplied = 12 kg ➜ Equilibrium Price = ₹100, Equilibrium Quantity = 12 kg.
Graph Meaning
Equilibrium Graph
⁕ Demand curve (DM) slopes downward
⁕ Supply curve (SM) slopes upward
⁕ Both curves intersect at point E
⁕ Point E = Equilibrium ➜ Price = ₹100, Quantity = 12 kg
Equilibrium
⁕ Demand = Supply
⁕ No shortage
⁕ No surplus
Does Market Equilibrium Exist in the Real World?
In theory, equilibrium is a fixed point where demand meets supply. In real life, markets keep changing, so equilibrium is never fully stable.
In Simple Words
Real markets never stay still — they keep adjusting toward a new balance point.
Markets and Changing Equilibrium
Factors That Change Markets
⁕ Technology
⁕ Wages
⁕ Interest rates
⁕ Wars
⁕ Political events
⁕ Pandemics
⁕ Weather
⁕ Natural disasters
Impact on Demand and Supply
⁕ These factors change demand and supply.
⁕ Market conditions keep changing.
Equilibrium in Reality
⁕ Equilibrium is not fixed.
⁕ Markets constantly move towards a new equilibrium.
⁕ Real-world equilibrium keeps shifting over time.
Role of Government in the Economy
The government steps in to make markets fair, since markets alone don’t always work fairly for everyone.
In Simple Words
Markets run on demand and supply, but the government helps keep things fair.
Why Government Intervenes
⁕ Markets allocate goods based on willingness and ability to pay.
⁕ If essential goods (like medicines) become too costly, poor people may not afford them.
⁕ Government intervenes to ensure fairness and protect vulnerable, low-income groups.
Exam Fact
India is a market-based, regulated economy — prices depend on demand and supply, but government keeps a check for fairness.
Regulation of Unfair Practices
Tools Used by Government
- Price Ceiling: Maximum price a seller can charge (e.g., medicines) — prevents overcharging.
- Price Floor: Minimum price/wage that must be paid (e.g., minimum wage) — protects workers.
- Regulating monopoly: keeping prices and supply of dominant sellers in check.
Imp Points
- A monopoly (single/few sellers) can charge high prices, give poor quality, and restrict supply.
- Monopoly harms consumer welfare, so government controls it.
- Regulators ensure transparency in markets:
- RBI – banking
- Central Consumer Protection Authority – consumer rights, unfair trade
- TRAI – telecommunications
- SEBI – securities market
Provision of Public Goods
Goods and services provided by the government for the benefit of all citizens.
⁕ Examples: Roads, bridges, parks, streetlighting, defence, sanitation.
⁕ No Direct Profit: Private companies won’t build them because they don’t generate direct revenue.
⁕ Free-Rider Problem: Private funding fails because people expect others to pay while they use them for free.
⁕ Government Role: Public funding guarantees equal access and social welfare for all.
Limitations of Government Intervention
Even though government regulation is needed, too much intervention can harm the market.
a) Price distortions and reduced producer incentives
Government fixing prices below market level reduces producer motivation.
Example:
Govt caps wheat price at ₹20/kg, but market price is ₹30/kg ➜ farmers earn less ➜ production falls ➜ shortage.
Remember
Price fixed too low ➜ Producers supply less ➜ Shortage
b) Compliance burdens
⁕ Regulations, licenses, and permits increase cost and time for businesses.
⁕ Hurts small businesses the most.
Example:
A small restaurant needs permissions for food safety, fire safety, pollution control, and local clearance.
Remember
More rules ➜ More cost/time ➜ Harder to start or grow a business
c) Discourages innovation and entrepreneurship
⁕ Heavy regulation and price controls reduce incentive to invest in better technology. Example:
Farmers won’t invest in better seeds or irrigation if price controls reduce their returns.
⁕ This lowers long-term productivity.
Exam Fact
Price controls can reduce both current supply and future innovation.
######## End Of Notes ########
![Latest Class 9 NCERT Textbooks [PDF]](https://studyless.in/wp-content/uploads/2026/04/Latest-Class-9-NCERT-Textbooks-PDF-1200x675.webp)



You do not write describe the element that effect the demand
I did not get your point. Could you explain what is missing
Describe the element that effect the demand
Everything is so proper , love it .
Amazing !